Well, it’s official, we are more than halfway through the year. With that, it will give us an opportunity to compare the first half of this year, with other years over this same time period. This can give us some perspective on what things are normal and just a part of the expected cycle of activity and also help identify what might be a sign of change. Plus the question about the coming election keeps surfacing, so we will touch on that briefly here, but also focus more on this in the webinar next week.
Mortgage Rates
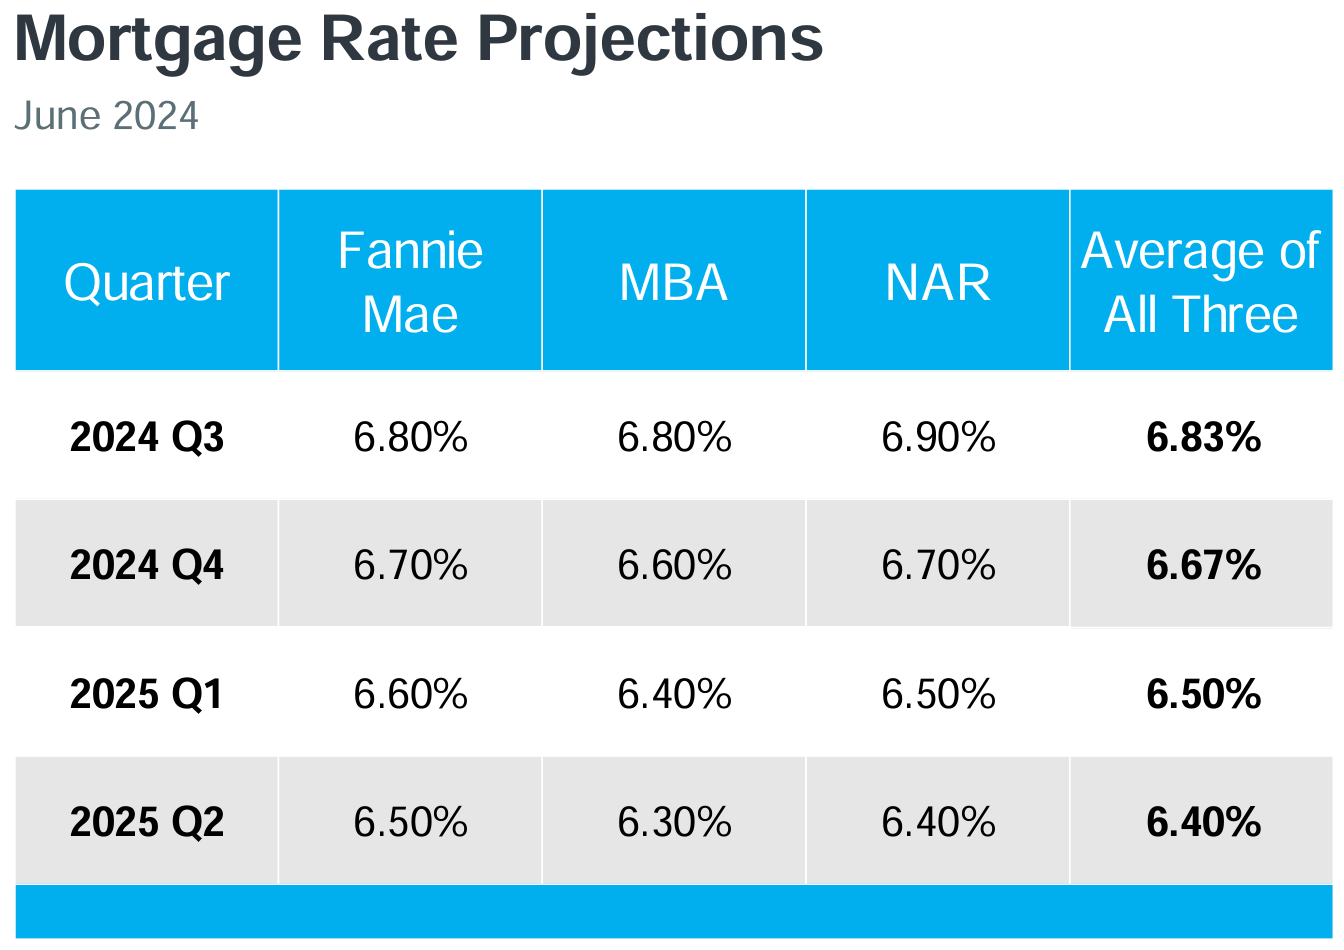
This is always high on the list of factors, although for some time now, there hasn’t been much to report. Despite hearing that rates are expected to fall for many months, there really hasn’t been any relief here. Also, the calls for rate expectations have been more tapered and been pushed out a little further. Currently for well qualified buyers, rates are fluctuating right around 7% (lower if you are paying points). Although you continue to hear calls for rate drops, the table below shows the projections for rate relief over the next year. As you can see, there isn’t a ton expected, so if you have put your plans on hold to wait for lower rates, it might make sense to call your lender and see if there are other options that you could use to make it affordable now.
Also, it is worth noting that we are still seeing around 70% of the purchases getting financed and 30% of them in cash. This is in line with the norms that we have seen over the last few years.
Median Price
It is really interesting to watch how the median has been moving. Over the past few months, we have seen inventory continue to grow, but with that we have seen the median price grow as well. WIth more choices and competition among sellers, many buyers would not be wrong for thinking that this could potentially bring prices down. Although there has been the need for price reductions on some listings, overall it appears that prices are remaining firm. Last month the median increased to $761,000 and this is almost exactly in line with where we were at this time last year and it is sitting at all time highs. We often caution people to get too caught up in this number as it can be greatly influenced by extremes in the market. For instance, last month there were 3 homes above $4M that sold while last year at this time there was only 1. We could do this across each price point and see why the averages and median shift based on this.
New Listings and Homes for Sale (Inventory)
The first half of the year almost always sees the number of new homes grow until roughly this time. The chart below shows just how stable this pattern is. In 3 of the last 4 years we saw the highest number of new listings happen in June before dropping in July. This year, the high took place in May with the drop coming in June. It is rare that they tick back up after this point, so if you are a buyer waiting to see what else is new, we would expect there to be fewer new options in the coming months.
With a downtick in the number of new listings, what does this mean for the number of homes actually for sale? WIth fewer pending sales (we will get to this in a moment), the number of homes available for sale has increased both month over month and year over year. Right now in Bend, there are 1120 homes for sale which is an increase from 1043 last month and 927 at this time last year. Before you get too worked up about the growing inventory, we would like to provide a little perspective and show that in 2019, there were 1515 homes for sale in the month of June, which is 35% higher than where we are now.
Pending Sales and Sold Homes
Seasonally this is usually the time of year where we see sales peak and then start to drop until sometime in the fall. In June we saw the number of Pending sales tick down slightly from May and this drop was on par with what we saw at this time last year. For the charts below, we expanded them to include more time so you can see just how steady this pattern is and where we currently sit in terms of the expected ranges.
In terms of number of sales, this is really more reflective of the pending sales from the month prior, and this has remained relatively steady month over month. In June, we saw 240 sales in Bend. This however is much lower than what we saw in June 2023 (294) and is significantly lower than previous years as well. In fact, if you look at this number over the years leading up to the pandemic you can see that normally this number is closer to 350. So if it feels like sales are light, you are right, they are definitely a bit leaner than what we had been accustomed to. As we prep for our next State of the Market, we will be diving into the reasons we expect the sales to increase next year. If you want to download the current edition, see prior ones, and be on the list to get a copy of the next one,
CLICK HERE.
Days on Market (DOM)
Despite some movement this year for the median days on market (we have been as high as 48 and as low as 12 in 2024), we are actually remarkably similar to many of the recent years. We point this out, because sometimes when you see such significant shifts in the span of just a few months, it feels like the world is changing. However, when you zoom out and look at the big picture, the market is often very predictable and consistent, despite changes in the world, economy, etc. Also worth noting is that although the median is ticking up and sits just shy of 3 weeks, there are still 25% of the current pending sales taking place in the first week of a listing.
Some other points to consider...
Sale to List Price: This has remained steady and is currently at an average of 98.4% of list price. For perspective, the median sale has now spent three months in a row at 100%.
Here is a chart of this over the past few years.
Inflation: This is always in the news and drives a lot of the interest rate discussions, so we have included a chart of this
here.
Building Permits: This helps us track what to expect in terms of new construction that may be in the pipeline and in June we saw a huge jump to 78. This the highest number we have seen since 2022 and is a good sign that builders are still confident in the market.
We hope you find this information valuable and that it helps you towards your ultimate real estate goals. If you have any questions about this month’s content or would like to dive a little deeper into the data, please reach out to your Ladd Group broker. If you don’t have one, you can reach me at
[email protected] or on my cell at 541-280-2132.
There are also several ways to reach the team, so please let us know how we can help.
Click here to sign up for our monthly newsletter! You can unsubscribe anytime.