Although this summer has seen a slowdown in activity compared to previous years, August has given us plenty to discuss. In the following paragraphs, we will touch on recent changes in mortgage rates, prices, and overall sales activity. We recently completed a webinar discussing the expected impact of upcoming elections; please visit our
YouTube page if you'd like to watch it. Now, let’s dive into the details of the current market conditions.
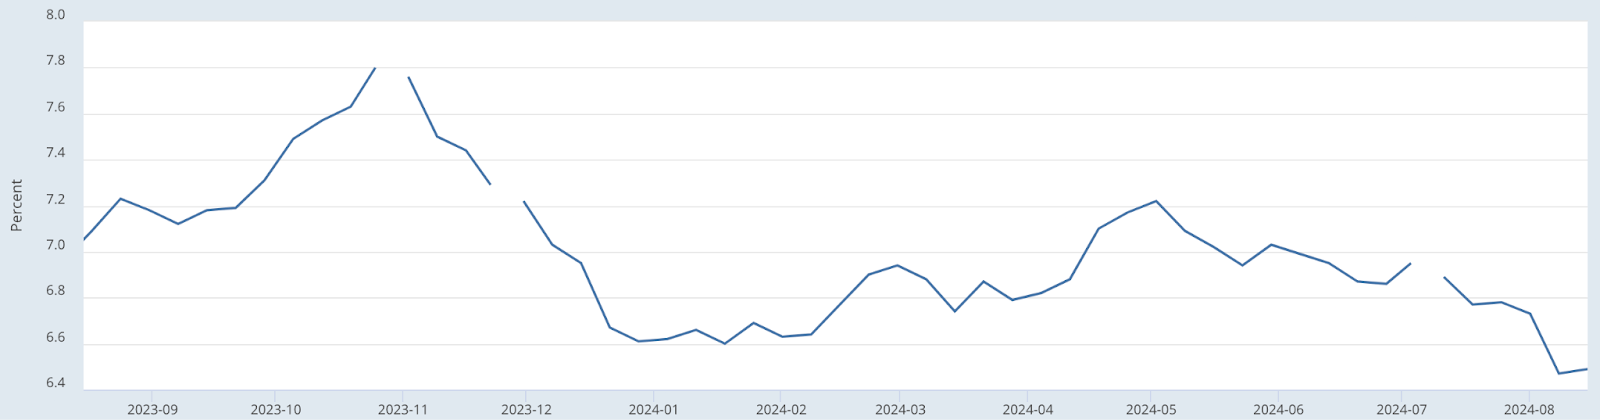
Mortgage Rates
It seems like experts have been discussing rate relief for over a year, but until recently, we hadn't seen much progress. However, since Memorial Day, rates have decreased by about 0.5%. This is the lowest level of the year and about 1.5% lower than the highs we saw in October/November 2023. To do some quick math, this recent 0.5% drop in rates on a $550k loan translates to approximately $200 per month in savings for a buyer. This will certainly prompt some buyers to reconsider a purchase and have others on high alert for further changes. If rates continue to decrease and fall below 6%, we would expect a significant increase in buyer activity. Although the Fed Rate is different from mortgage rates, many people are closely watching the Fed’s decisions in the coming months, as these could also influence where mortgage rates trend. Here’s a snapshot of what mortgage rates have looked like over the past 12 months.
Median Price
With growing inventory and a slower sales pace, one might expect more significant changes in the median price, but we haven't seen that yet. This past month, the median price ticked slightly lower, dipping just below its June highs. In Bend, the median price for a single-family home is now just over $800k. Although this is up from the low $700,000 range at the beginning of the year, it's now almost exactly where it was at this time last year. The pattern of rising prices through early to mid-summer, followed by a tapering into the fall and winter, is very normal, so we'll be watching to see if this trend continues. Please also keep in mind that historically, the largest number of expensive homes come on the market and sell in the spring and summer, which tends to pull the median (and average) price higher. In other words, while prices trended higher in the first half of the year and may trend lower in the second half, this isn't necessarily an indication of shifts in the market. At this point, we're seeing the cyclical patterns we would expect, but we'll continue tracking other data points to provide greater insights.
New Listings and Pending Sales
Much like the median price, new listings also seem to be tapering off. As we've discussed, the number of new listings typically increases throughout the first half of the year and then slows in the second half. One thing we heard repeatedly from buyers this spring was that they wanted to see what else would come on the market. Each week, it seemed like new options were becoming available, and with interest rates hovering around 7% and fewer homes going pending, buyers didn't feel a strong need to act quickly. Instead, they were waiting to see if anything new and interesting caught their attention. However, with the number of new listings now dropping and interest rates as well, this might prompt buyers to make moves on some of the current options.
We saw a drop in the number of pending sales in June, but this ticked up again in July. For a quick comparison, July's pending sales were almost exactly what they were in each of the last few years, though still significantly below pre-pandemic levels. As discussed in previous reports, pending sales peak in mid-summer and then gradually decline throughout the second half of the year, often with a slight uptick in the fall. However, with the recent drop in interest rates, we may see pending activity hold steady a bit longer.
Homes for Sale and Sold Homes
On average, there were about 1,200 homes and townhomes for sale across Bend in July. As we've discussed, this number has increased over the past few years and is now at its highest level since before the pandemic. While inventory is still significantly lower compared to the late 2010s, it is gradually catching up.
One thing we wanted to highlight is that there’s almost always a story deeper than the surface statistics. If you look at the chart above, you’ll see a relatively normal pattern of activity. However, when you break down those approximately 1,200 homes, an interesting shift in the type of homes for sale becomes apparent. Looking at the first chart, the number of single-family homes appears relatively consistent and on trend with prior patterns. However, when you focus on townhouses and condos, there’s been a significant increase in standing inventory. This could indicate that either a large number of new townhouses and condos have come on the market, or perhaps buyer demand for these types of properties has decreased. If you’re interested in exploring this or other hidden trends further, please give us a call.
Days on Market (DOM)
As we discussed last month, we’ve seen some wild swings in this data point so far this year. Currently, the median days on market stand at 26, with an average of 49. As a reminder, the median is simply the midpoint of the range, so when the average is higher, it indicates that some homes that sold last month had been on the market for quite some time. For example, whether a home has been on the market for 100 or 300 days counts as only one data point in the median but can have a much greater impact on the average, especially when the number of sales is low.
Some other points to consider...
Sale to List Price: This has remained steady and is currently at an average of 98.5% of list price.
Here is a chart of this over the past few years. Please keep in mind that this is the sale to last list price. If you take into account sale to original list price (price before any price reductions), this stat is closer to 96%.
Inflation: This is always in the news and drives a lot of the interest rate discussions, so we have included a chart of this
here. As of now, this continues to trend toward the Fed’s desired target, which is why they are considering rate cuts.
Quick Sales (Buyer Demand): We have been tracking this for some time now, and about 25% of the current pending sales happened in less than a week. So although Days on Market has risen, if homes are priced and marketed well, they can still sell very quickly.
We hope you find this information valuable and that it helps you towards your ultimate real estate goals. If you have any questions about this month’s content or would like to dive a little deeper into the data, please reach out to your Ladd Group broker. If you don’t have one, you can reach me at
[email protected] or on my cell at 541-280-2132.
There are also several ways to reach the team, so please let us know how we can help.
Click here to sign up for our monthly newsletter! You can unsubscribe anytime.